 . . brings a decentralized and democratic economic platform to the real economy! . . brings a decentralized and democratic economic platform to the real economy! |
||||||
Cloud Capital Chamber of Economies Cloudfunding CloudfundMe Buyers Crowd Sellers P2P Groups Places SignUp |
||||||
Business Cycles can be Mastered by Cloud Commerce |
the 'D.O.M.E.' FOMEZ FOMEZ - Localization Productivity First RingLink Tech e2eCommerce Cloud Productivity UDC - Neutral Currency Local - Capital Flows Balance of Payments Pay It Forward, Now! Digitizing Cash Booms and Busts Open Market Revenue Automation - AI Fractional Economics Supply Chain Economies of Scale Exchange Platform Global Locations Distribution of Wealth Labour MarketPlace Affordable Living Job Creation |
|||||
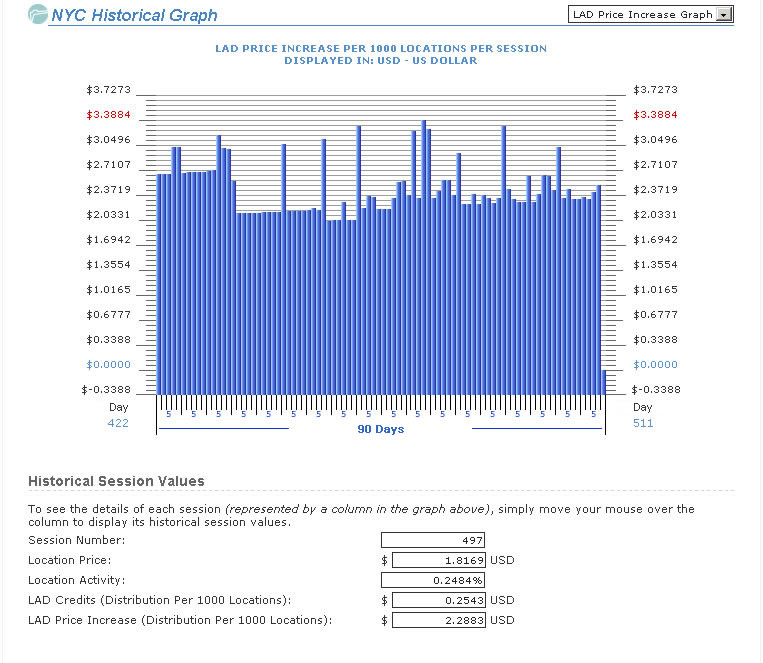
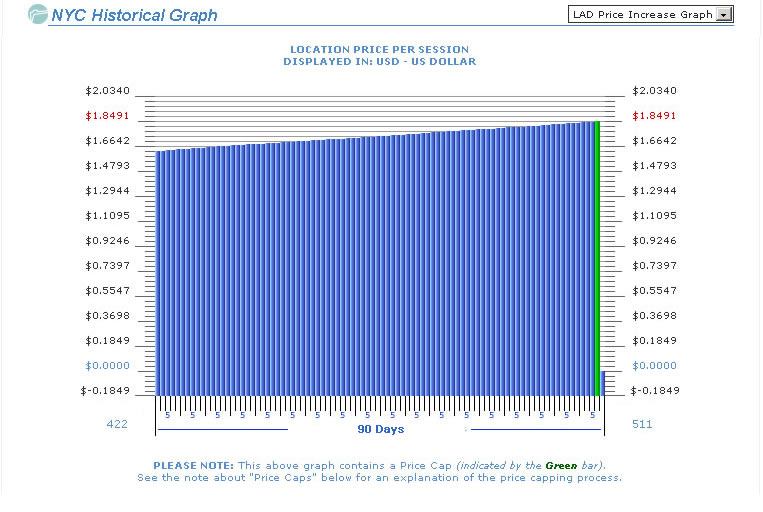
| Business Cycles are often referred to in economics and commerce as boom and bust cycles, which steers a business's future Capital Investment in infrastructure and in the amount of inventory that it sits with. Below and to the right are some statistical graphs showing the Business Cycles of the USA over the last 50 years but before the GFC. Typical supply and demand usually has a dominant party, in the boom time the seller is able to sell at the full selling prices but when the downward trend towards the bust is happening then the seller begins to discount, which favors the buyer. The outcome from sellers using discounts as the main way to stay in business reduces the amount of currency flowing around the economy. This slowness of currency leads to less production and less employment. The dynamics changed with Fractional Economics allow the 'peaks and troughs' to not happen when the 'sell high and buy low' is maintained. Sellers can use predictable selling to find the smooth flow of turnover of stock and consistent cashflows. To give sellers even more options there's Flexi-Deals for when local markets need that bit of flexibility. Below the Figures 1 - 6 are two graphs from the D.O.M.E. Platform showing the 'productivity' inside a selected location ( city ) that has sold 'productivity' showing the different trends that can be mastered using modern technology. The linear growth shown in the lower graph below Figures 1 - 6 is what occurs when 'supply and demand' can be incentivized for both the buyer and the seller with the same item - growth can be maintained. |
 Source: Wikipedia Source: Wikipedia |
|||||
If we were to take snapshots of an economy at different points in time, no two photos would look alike. This occurs for two reasons:
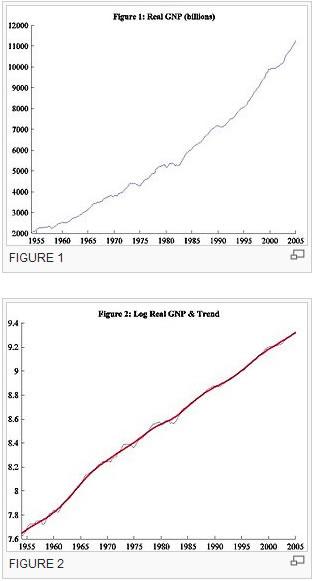
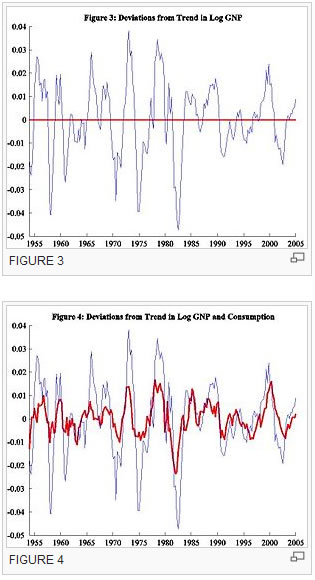
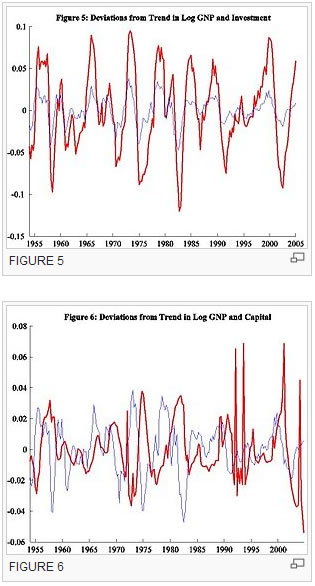
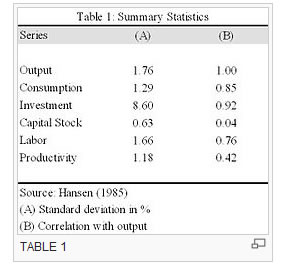
A common way to observe such behavior is by looking at a time series of an economy’s output, more specifically gross national product (GNP). This is just the value of the goods and services produced by a country’s businesses and workers. Figure 1 shows the time series of real GNP for the United States from 1954-2005. While we see continuous growth of output, it is not a steady increase. There are times of faster growth and times of slower growth. Figure 2 transforms these levels into growth rates of real GNP and extracts a smoother growth trend. Observe the difference between this growth component and the jerkier data. Economists refer to these cyclical movements about the trend as business cycles. Figure 3 explicitly captures such deviations. Note the horizontal axis at 0. A point on this line indicates at that year, there is no deviation from the trend. All other points above and below the line imply deviations. By using log real GNP the distance between any point and the 0 line roughly equals the percentage deviation from the long run growth trend. We call large positive deviations (those above the 0 axis) peaks. We call relatively large negative deviations (those below the 0 axis) troughs. A series of positive deviations leading to peaks are booms and a series of negative deviations leading to troughs are recessions. At a glance, the deviations just look like a string of waves bunched together—nothing about it appears consistent. To explain causes of such fluctuations may appear rather difficult given these irregularities. However, if we consider other macroeconomic variables, we will observe patterns in these irregularities. For example, consider Figure 4 which depicts fluctuations in output and consumption spending, i.e. what people buy and use at any given period. Observe how the peaks and troughs align at almost the same places and how the upturns and downturns coincide. We might predict that other similar data may exhibit similar qualities. For example, (a) Labour Market, hours worked (b) productivity, how effective firms use such capital or Labour Market, (c) Capital Investment, amount of capital saved to help future endeavors, and (d) capital stock, value of machines, buildings and other equipment that help firms produce their goods. While Figure 5 shows a similar story for Capital Investment, the relationship with capital in Figure 6 departs from the story. We need a way to pin down a better story; one way is to look at some statistics. Source: Wikipedia |
||||||
 |
||||||
 |
||||||
 |
||||||
| Source: Wikipedia | ||||||
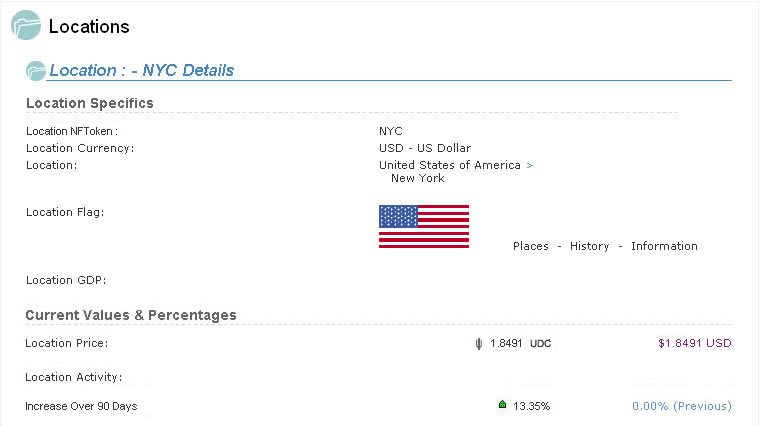
In comparison with the Figures 1 - 6 above showing the constant booms and busts that occur in economies using the current mechanics in modern economics - the D.O.M.E. Platform moves deeper into the ingredients that make up the productivity of individual products and services sold within a location. Each item made by a manufacturer or made available for sale by a retailer gives each business its own Business Cycle, that when aggregated with all other products and services released for processing on the Platform by all the various sellers, in their own time frame, it avoids the boom and bust cycles, - this time frame for each Business Cycle can be similar to an ocean where each wave only has so many sellers with their products and services, as the waves hit the shore ( market ) there's a consistency that's accepted as the normal way the oceans work. - the waves of sales can be spread over the day or week's trading time, not all the sales happen at the exact moment, it fits in with the buyers time and demand for a product. But when a force such as what causes a tsunami ( recession ) comes along there's destruction and a seller's small wave becomes insignificant as it's scooped up in the turmoil. - what the D.O.M.E. Platform does is use technology and economies of scale to spread the Business Cycle across the broader economy to avoid any major impact, whatever the cause, it keeps the businesses and the buyers insulated. - this essentially comes about by the buyers and sellers operating on a cash only Platform, that's not effected by the banking system. - it uses Cloud Commerce to maintain local demand using an overall global Crowd Power to sell products and services, even before they are released to local buyers, it ensures constant productivity and avoids major impacts. - central banks usually adjust the interest rates to trigger the pace and flow of funds exchanged between the buyer and the seller ( scarcity of lending funds to borrowers ) to soften the extremes of the peaks and troughs. Unlike where each country has their own trigger mechanisms or policies to speed up or slow down their economy that works for or against other countries, the D.O.M.E. Platform operates outside that structure, which allows the flow of productivity to operate non-stop and ubiquitously 24/7 with its owneconomies of scale. The productivity generated on the Platform is always limited by the supply, therefore over-production ( saturation of a market ) is limited by the demand, this means that if and when any product or service is listed on the Platform to sell, the demand comes into play at the initial process stage where there needs to be sufficient interest between local and global buyers ( OMMs - global bidders ) for the item to move to the full processing stage. Busts can be blamed on the lose of demand but that along is not the full explanation, demand reaches its maximum when all the possible buyers have purchased all that they need, this is rare when the world is available to export to. A major cause of a bust is the frequent actions of sellers using the discounting tool which leads to reducing their profit and starts to squeeze their suppliers and reduce operating costs, this discount tool is used as a random mechanism to find demand, the damage caused is never questioned. The question is - Where does the value between the full value and the discounted value go? The Trade Routes of old will not be the same as those in the new digital era, for manufacturers and suppliers along the Supply Chain there's already been a major shift to selling online, - with Cloud Commerce the next step in global trade comes with the New P2P Economy helping to form the New Digital Trade Routes. Regardless of the amount of productivity that's happening in the one location, or in all locations on the Platform, Cloud Commerce can still maintain the incentive for both the buyer and the seller, simultaneously - even if the volume of productivity is zero in some locations there's never a negative growth, where some locations may have minimal productivity there will be other locations that will have activity and growth. The individual growth in one location comes about from a micro-tax that is hidden from view or from causing any hindrance in the flow of activity, this value is distributed to the users who are connected to the location by holding any number of units of the Location Token. This micro-tax is collected and distributed to all the users who are each holding the quantities of Location Tokens in real-time - this increase in value of each Symbol is true growth, which when combined as an overall value across all the Symbols held by a user, there's the continual distribution of wealth that the overall economy is producing. ( graphs are results of productivity using actual user interactions ) |
||||||
  |
||||||
 |
||||||
Fact: Modern technically driven commodity markets are a long way removed from the old chalk board trading environment where pace was more in tune with 'movement' of trade. Today's commodity markets are operated by software that favors those inside the environment ( in particular HFT - high frequency trading ) that can command how high the real world needs to jump, disregarding the inequality that it creates. The Platform counters that control by providing all players in the Supply Chain with use of Global Cloud Productivity to set fair and reasonable list selling prices that can be sustainable by individual players or industries globally, regardless of what global commodity market prices may be - leveling the playing field! The change the Platform makes is more productive and starts well before typical economies begin to apply their taxing system - typically a tax is usually a reasonable percentage of a sell price with the main objective being to raise revenue for the running of an economy, - unfortunately extra tax ( tariffs ) is often added to imported products to help control and balance prices to protect domestic made products to compete against imports, which are more than likely helped along with subsidy by the foreign country of origin, - tax revenue raised and then used to defend domestic markets by subsidizing the Seller begins to muddy the water when using it in this tit for tat approach, The Platform on the other hand applies a different approach, it's built on a global scale rather than at a country level and raises revenue prior to the initial stage to where typical tax is applied, and it's done with a subtle approach that doesn't hinder the activity, - it applies Location Activity Tax at the global level instead of in a domestic environment to collect and pay the Seller the full selling price, whilst reducing the buying price by subsidizing the Buyer - all done without using or denying any domestic tax revenue due on the Seller's full prices, - Location Activity Tax and Fractional Commerce reverses how subsidizing is applied without having the impact of forcing higher prices by using recycled tax. - this is the RunWay we're now on, with the New P2P Economy! |
||||||
Check out a Deal Registration and Cloudfund Strategy See a Snap-Shot view of a Cloudfund strategy and bidding for Deals Cloudfunding generates Price Demand - digitizes 'cash' to flow ubiquitously around the world What's The Monetizing Moment? Cloud Commerce operates by Outsourcing the Selling to the Crowd by Cloudfunding How Sellers Outsource their Selling to the Crowd? |
||||||
|
||||||
| Cloudfunding to Scale l Locations being funded l Want a local FastFill Outlet in your area? | ||||||
| About Us Contact Privacy Policy Terms of Service |
||||||